
Dear fellow investors,
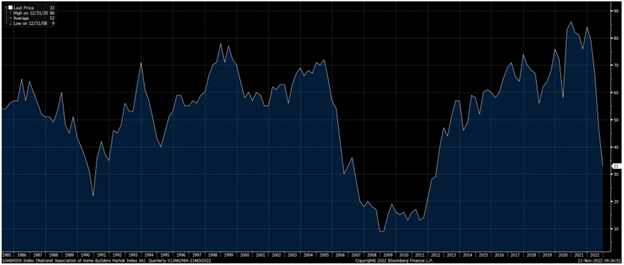
The Wall Street Journal reported last week that the National Association of Home Builders’ (NAHB) sentiment about the future was 33% and at its lowest since 2012. As you can guess, the contrarianism in us kicked into high gear.
This raises four questions. What was going on in 2012 that made home builders so depressed about their future? What should you have done in 2012 with the shares of D.R. Horton (DHI) and Lennar (LEN) in response to the NAHB survey? What is going on now for home builders which makes them so uncertain and depressed about their future? Lastly, how should we as investors react to this sentiment?
In 2012, we were in the most anemic economic recovery from a recession in decades. In the prior year, home builders built 320,000 single-family homes and that was the lowest number built in the past 60 years!
Source: Bloomberg
Second, the two largest banks, Bank of America (BAC) and JPMorgan (JPM) were the embarrassed owners of hundreds of thousands of foreclosed homes. Senator Elizabeth Warren was cheerleading the Occupy Wall Street protests (organized hatred of lenders) and the future looked incredibly poor because the largest demographic adult group (millennials) wasn’t ready to engage in household formation and home buying.
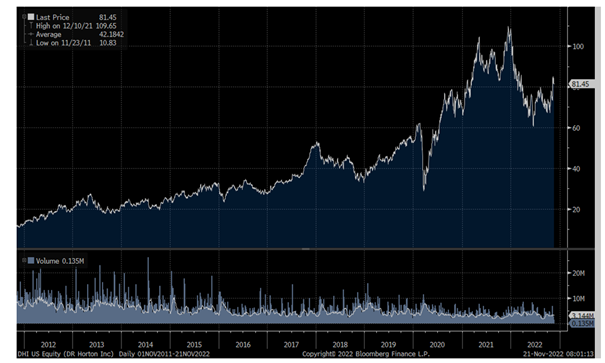
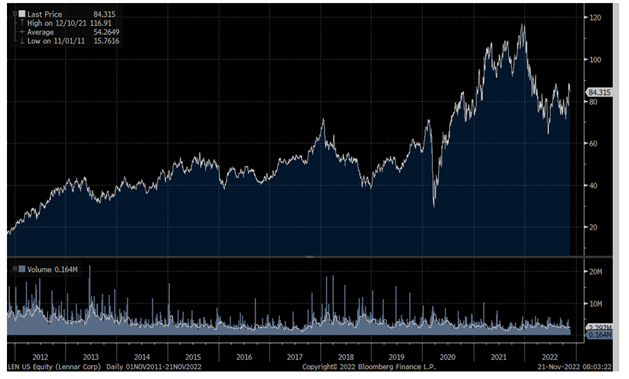
What should you have done in 2012 in response to the low builder sentiment? You should have bought every home builder you could get your hands on! Look at the chart of DHI and LEN over ten years.
Source: Bloomberg
Source: Bloomberg
Total Return (dividends reinvested) from 11/30/2011 to present:
- LEN – 351%
- DHI – 584%
Today, we’ve had an abrupt monetary tightening that is an effort to rein in inflation running at over 8%. This raises the possibility of a recession in 2023. The home building industry has reacted to very high historical spreads between the ten-year Treasury bond rate and the 30-year mortgage rate of over 3%. This is because a 30-year pool of mortgages lasts 11 years on average.
Buyers are shocked by the fact that they didn’t buy before mortgage rates moved up. The affordability of homes, in the most populous areas of the U.S., has declined from both higher home prices and higher mortgage rates. Compared to 2021 when both prices and demand were robust, things look lousy.
So, how should we react as investors? First, today’s temporarily difficult circumstances pale in comparison to the 2012 post-housing depression. There are 41.5% more people in the key home buying age group (27-42 years old) than ten years ago. Second, The Wall Street Journal reported that the average home buyer is moving farther away to find affordability (50 miles versus 15 miles). Builders have stronger balance sheets, higher market share and more overall corporate discipline than anyone had in 2012.
At the price-to-earnings ratios these builders trade for, they are more than discounting worst-case scenarios. At the bottom in the fall of 2022, they were trading for five times after-tax profits. The bear case on these stocks stopped working in recent months. As builder sentiment got worse, the stocks rose in the face of the pessimism. Sir John Templeton would say we’ve passed the point of maximum pessimism.
We like our position in home builders and as contrarians, we love the fact that most investors fear to tread in the industry.
Fear stock market failure,

William Smead
The information contained in this missive represents Smead Capital Management’s opinions, and should not be construed as personalized or individualized investment advice and are subject to change. Past performance is no guarantee of future results. Bill Smead, CIO, wrote this article. It should not be assumed that investing in any securities mentioned above will or will not be profitable. Portfolio composition is subject to change at any time and references to specific securities, industries and sectors in this letter are not recommendations to purchase or sell any particular security. Current and future portfolio holdings are subject to risk. In preparing this document, SCM has relied upon and assumed, without independent verification, the accuracy and completeness of all information available from public sources. A list of all recommendations made by Smead Capital Management within the past twelve-month period is available upon request.
©2022 Smead Capital Management, Inc. All rights reserved.
This Missive and others are available at www.smeadcap.com