Dear Fellow Investors:
“Back to school. Back to school, to prove to Dad that I’m not a fool. I got my lunch packed up, my boots tied tight, I hope I don’t get in a fight. Oh! Back to school… back to school… back to school” – Billy Madison
As school season kicks off, we at Smead Capital Management have been perplexed by the logic and reasoning over the student debt debate in America. There is a consensus in the investment markets today believing that student debt is a major credit problem rivaling other credit problems that were disastrous over the last 30 years. Much like Billy Madison had to prove to his father that he wasn’t completely helpless, today’s students have the daunting task of not only affording college and graduate education, but also finding ways to pay it off over the next 20 years. Billy had to hope to not pick a fight. We don’t have the same sentiment because as contrarians we have to find problems and contentious companies/industries. This seeks to explain the lies, damned lies and the statistics surrounding the student debt myth in the United States.
Lies
“A nation that is afraid to let its people judge the truth and falsehood in an open market is a nation that is afraid of its people.” –John F. Kennedy
The U.S. economy has had a tough stretch since the tech bubble broke in March 2000. Talking heads quote numbers about student debt reaching 1 trillion dollars. Few, if any pundits have dug underneath the surface to learn how consequential their arguments are. While 1 trillion dollars of student debt may be an accurate number, it is not proof that a student debt problem exists. A number without context is just a number.
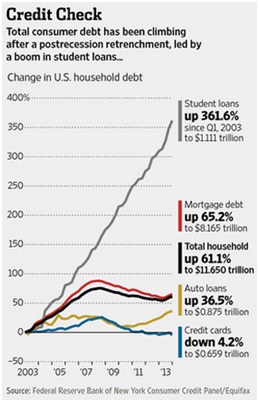
A prime example of what pundits cite on this issue is the growth of student debt since 2003 as reported by the New York Federal Reserve Bank. The chart to the right depicts their data. The growth in student debt relative to any other category looks gargantuan at first glance. This single snapshot fuels much of the fear around this whole issue, but does it truly show a problem?
A second aspect of the anguish surrounding student debt actually has very little to do with the debt, but instead reflects the frustration over the economy and a lack of wage growth during the last decade. The chart below shows that, despite student debt increasing from 2001 to 2010, mean wage income has dropped since 2001, a legitimate frustration to be sure.
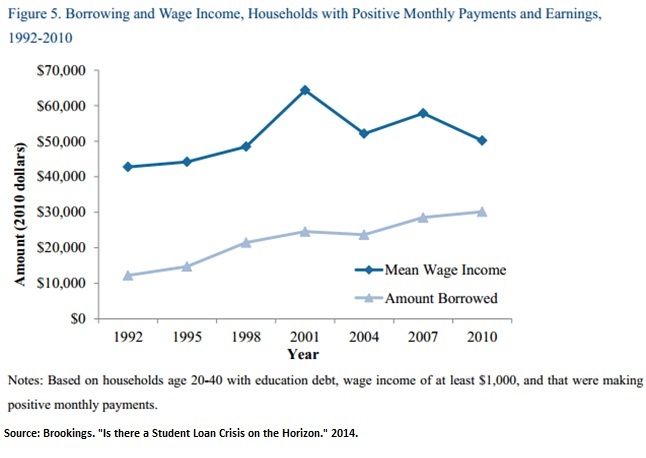
We can sum up the frustration like this: if we are creating more debt in the name of education, there should be a corresponding growth in the wages of America. Wage growth has been a missing benefit that understandably frustrates citizens and politicians alike. This doesn’t point to an easily identified problem, but possibly a cyclical or unique circumstance.
Damned Lies
“If you put the federal government in charge of the Sahara Desert, in five years there’d be a shortage of sand.”
― Milton Friedman
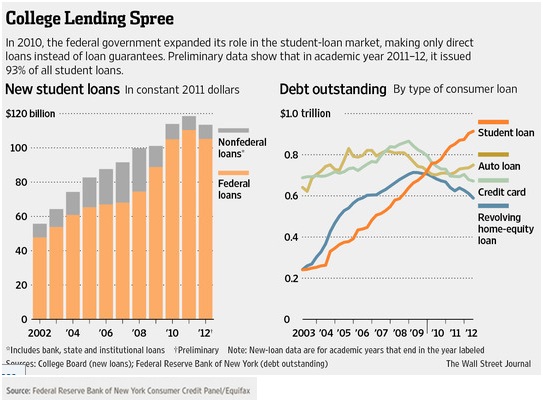
In an effort to address the anguish and outcry of rising debt, the long silent player, the federal government, has taken a prominent and active role in the student debt market. On the back of the Affordable Care Act, a little talked about provision provided the federal government the ability to takeover the federally-funded student loan programs. This provision no longer allows private companies to provide federally-subsidized lending to the student loan marketplace. It’s clear to us that the government now views these loans as a public good and thus would best be administrated by someone not seeking a profit; loans have moved from privilege to entitlement. Below is a chart showing the growth of federal loans since 2002. The rapid increase began in 2008 when the government takeover took place.
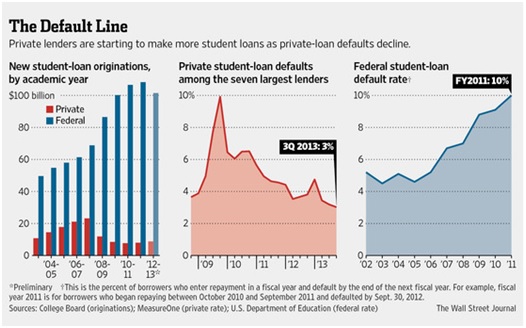
The data shows that the federal government is en route to doubling the amount of capital being thrown at the “educating the future of America.” In our view, the political rhetoric and government goals for student lending have not matched up with what is economically valuable. According to the Department of Education, the current default rate on loans for students who have been out of school for at least two years is 10%. This is the highest default rate since 1995, indicating that this is the worst underwriting of federal student loans in almost 20 years. Below, the chart to the far right depicts the climb in default rates among federal student loans in recent years. The chart in the center highlights the default rates in private student debt among the seven largest lenders. These private lenders are experiencing 3% default rates versus the federal government’s 10%. It looks to us like the government’s ability and willingness to provide capital to the marketplace is increasingly uneconomic and misallocated. Friedman might say that in student lending, they’ve run out of sand.
Statistics
“Facts are stubborn things, but statistics are pliable.” —Mark Twain
Despite the big-picture and alarming charts above, three problems with student loans are far more distant. The $1 trillion outstanding student debt number is so big to the average person’s mind that it immediately leads to fear. This is very analogous to people fearing the levels of household debt today, which is high. Both of these pictures only look at the balance sheet side of the situation and not the income statement. As we have harped numerous times in our writings over the last three years, the household debt service ratio levels are the lowest since 1980, when the Federal Reserve began recording the data. Correspondingly, student debt service ratios are historically normal and/or depressed as depicted by the chart below from a recent Brookings Institute Report.
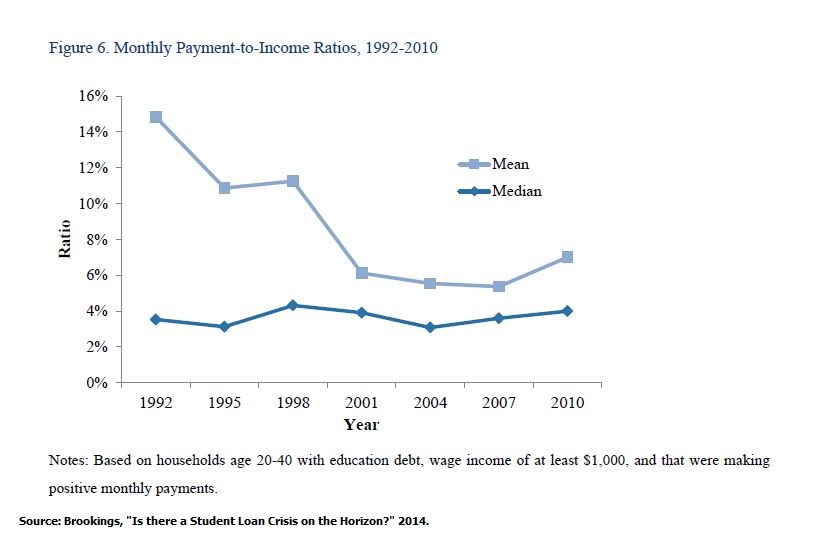
The data shows there have been large improvements in the payment of debt compared to other historical periods on average. It was worse to be a student in a graduate program during the 1990s, despite lower average amounts of debt compared to today. The data clearly shows how intelligent the consumer has been on this subject. They are financing one of the best self-improvement vehicles in life at one of the best times to do it.
Stupid? No. Brilliant? Yes.
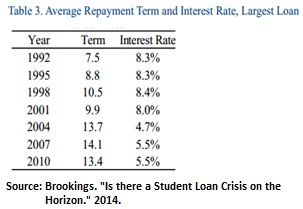
The table to the right shows interest rates that have been paid for student debt since 1992. Once again, further evidence that the consumer of student debt is being opportune, unlike the brilliant pessimists in the market would have you believe.
The big demystifying revelation about student debt comes from the snapshot of how much student debt is actually held by households between 20 to 40 years old. Numerous articles over the last three years have capitalized on our fear by making everyone believe there are huge pools of students with an excess of $50,000 in debt. Below are articles from major publications over the last three years that showcase households in more than $80,000 of student debt.
“A Generation Hobbled by the Soaring Cost of College,” New York Times. May 12, 2012.
“Millennials’ ball-and-chain: Student loan debt,” USA Today. July 1, 2013
“Banks Take Interest in College Lending,” The Wall Street Journal. Feb 24, 2014.
The chart below debunks this myth:

As of 2010, 76% of households have less than $20,000 of debt, with most of that camp having less than $10,000 in debt. We are not dealing with major problems for the average student or household. The numbers have been skewed by outliers in the pie chart. Graduate programs and extremely expensive private colleges appear to have created the skew or fat tail for our stat-junky friends out there. The skew makes the averages look far larger than the economically realistic median. Taking on $10,000 to $20,000 of student debt to make an average of $25,000 per year in added salary over the next 20 years looks compelling from our end of the economic view. When you add the lowest interest rates in years, it looks even more compelling.
What does this mean for stock pickers?
As we look over the student loan landscape there are four main points to take away:
- Fear has driven the story.
- Debt levels are high, but not in light of income and debt services abilities.
- The government is misallocating capital.
- Many banks have reduced their involvement in the arena due to political rancor (a.k.a. less competition).
These are the kind of contentious circumstances we at Smead Capital Management like to find in hope of auditioning a company that will fit our eight criteria. In April of this year, we started by acquiring shares of Sallie Mae (SLM), which spun off into Sallie Mae (SLM), the bank, and Navient (NAVI), the servicer. As contentious as the student debt subject has been, we felt we were getting bargain prices for these businesses. The servicing side (NAVI) is thought to have no growth potential and trades at a microscopic eight times earnings. They know more about handling pools of student loans than any other business on the planet since they were originally a government-sponsored enterprise (GSE) of the U.S. government and have the best “big data” on the subject. The bank side (SLM) will be an issuer of private student loans. We think private student lending could grow dramatically once the federal program begins to eliminate loans to unworthy borrowers, or charge a more appropriate interest rate. Either side of this equation provides us an attractive opportunity in meritorious businesses and presents what we perceive to be a bargain. The lack of competition these businesses have could be their shareholders friend.
Stay contentious my friends,
Cole Smead, CFA
The information contained in this missive represents SCM’s opinions, and should not be construed as personalized or individualized investment advice. Past performance is no guarantee of future results. It should not be assumed that investing in any securities mentioned above will or will not be profitable. A list of all recommendations made by Smead Capital Management within the past twelve month period is available upon request.
This Missive and others are available at smeadcap.com
