Each year we are reminded of the fact that active management systemically underperforms the benchmark. The scorecards come in, and the tally is drilled back into our consciousness. But has the now long-tenured debate of active versus passive offered us much in the way of new perspective over the last several decades?
While passive indexes may have a role to play in various investors’ portfolios, the debate of active versus passive fails to address the most important aspect of fund investing: where to find alpha. The crux of this controversy, we contend, should not center on the idea of active management, but instead, on the managers who practice it. By looking at managers who meet certain criteria, we will demonstrate that these constituents often perform better than passive strategies, significantly better than the peer groups, and offer a strong probability of delivering alpha going forward.
This may be understood by taking a closer look at what is overlooked in studies such as the S&P Indices versus Active Scoreboard (SPIVA), compared to some explanatory factors related to the portfolios. We argue these factors are far more effective in revealing the important and germane questions of portfolio management: how to identify and track successful managers.
Historically, trying to apply science in an attempt to create an efficient and simplified investment process is nothing new. In 1863 French economist and stockbroker Jules Regnault published Calcul des Chances et Philosophie de la Bourse where he incorporated statistical and probability analysis in an attempt to show that stock prices move in random patterns. More than a century later, in 1970, Eugene Fama published his definitive papers outlining the Efficient Market Hypothesis and Burton Malkiel wrote Random Walk Down Wall Street shortly thereafter. By 1976, John Bogle’s Vanguard launched the world’s first Index Fund, replicating the S&P 500 which has had magnificent success. Consider the rapid proliferation of index and sector funds, as well as the ubiquitous and rapid growth of ETFs over the past decade.
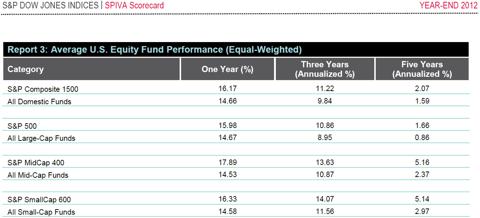
At Smead Capital Management, we like to find examples of Well Known Facts. We define this as economic themes known by everyone in the marketplace and acted on by most everyone who has capital to act. The recent SPIVA study results exemplify the aforementioned Well Known Fact that active managers cannot beat passive indexes:
Source: S&P Dow Jones Indices, CRSP. For periods ended Dec. 31, 2012. All index returns used are total returns. Funds are equal-weighted, but indices are not.
Source: S&P Dow Jones Indices, CRSP. For periods ended Dec. 31, 2012. Outperformance is based upon equal weighted fund counts. All index returns used are total returns.
We believe there are certain errors of omission that inherently position the active versus passive argument towards faulty and naïve conclusions. We need to examine the errors of omission within these studies, and reframe the question from the ground up. From Regnault to Fama, Bogle to SPIVA, few studies demonstrate an ability to ask the simple question of why active managers fail, and what factors are causal to the story. Accordingly, from media advertisements to CFA curriculum, we have raised an entire generation that attempts to add alpha through macroeconomic analysis. It seems nearly every talking-head attempts to add value through tactical asset-allocation, re-weighting asset-class buckets based on top-down views. Even as the causal question remain relatively untouched, the passive ideologues run their victory laps, and money pours into benchmark vehicles.
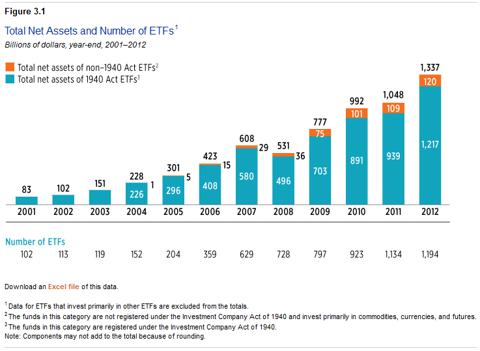
The investment community seems to have settled on the argument as presented to them, and concluded the culprit is active management. Consider this chart ICI’s 2013 Factbook, showing the Total Net Assets and Number of just ETF’s 2001-2012:
Source: Investment Company Institute 2013 Investment Company Fact Book, 53rd edition.
The ICI chart clearly shows that the investment community has not only settled on the ideology of passive management, they have capitalized the idea as well.
Even so, not every academic or investor is content with the dominant narrative that has emerged since Regnault’s publication over 150 years ago. Seven years ago, K.J. Martijn Cremers and Antti Petajisto addressed the question of whether being substantially different than a benchmark might add alpha. Cremers and Petajisto’s research allows us to not only look at the portfolio and the way it is managed, but also determine whether there is any systemic relation to performance.
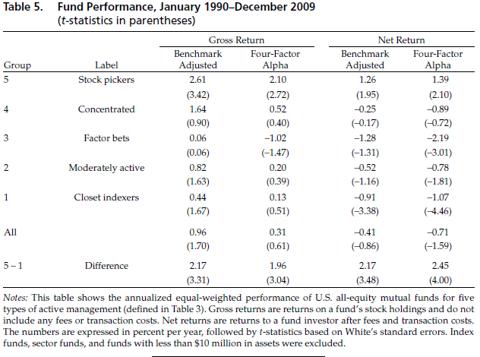
In a paper published in The Review of Financial Studies in August 2009, Cremers and Petajisto introduced “Active Share” as a metric to measure how much a manager is betting differently from the benchmark, and showed the efficacy of this metric in predicting positive alpha. The more you differ from the underlying benchmark, the higher your Active Share number. The more the portfolio looks like a replica of the benchmark, the lower your Active Share number. The findings were significant and showed persistency in generating future alpha as well:
Source: Financial Analysts Journal, 2013 Volume 69, Number 4
Notice group 5, which Cremers and Petajisto labeled “Stock Pickers.” This group added 1.26% of alpha per year after all fees and expenses over the 19 year period studied. This same group beat the “Closet indexers” by a whopping 2.17% per year over that same stretch. The need for practitioners to implement a concept such as Active Share could not be timelier. As we will develop in detail later, the constituents in the “stock pickers” category is as scarce as it has ever been, offering great value to those who are willing to give it serious attention. (As an aside: the fact that the “stock pickers” category is even smaller now than when the concept was introduced 7 years ago may offer anecdotal evidence against the efficient market hypothesis.)
We contend that Cremers and Petajisto are rightly moving this discussion to where it should be: the managers and the underlying portfolios. Not the category.
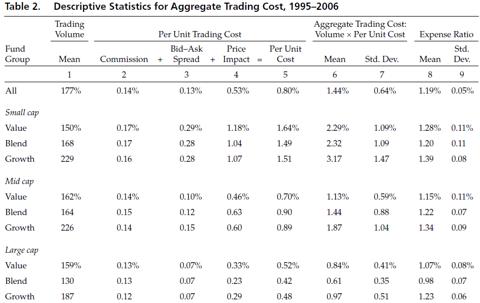
Another factor that has received recent attention, but has yet to factor into any SPIVA-type scorecards, is trading costs. We believe this is one of the single biggest contributors to active management underperformance. A snapshot of these “invisible” costs was recently taken by Roger Edelen, Richard Evans, and Gregory Kadlec, and published in a recent Financial Analyst Journal article in early 2013:
Source: Financial Analysts Journal, 2013 Volume 69, Number 1
The average costs associated with trading activities came to 1.44% for all Mutual Funds (Large Cap managers averaged 0.81%, Mid cap averaged 1.48%, and Small cap averaged 2.59%). Even more important is the differential among Active Managers. The 0.64% standard deviation around the 1.44% average tells us that by moving from +1 to -1 standard deviation from the mean, you save yourself 1.28% per year in performance. Breaking it down into quintiles tells a slightly harsher story. This comes from a study done by the Center for Retirement Research (CRR) at Boston College in 2007:
 Source: Center for Retirement Research at Boston College
The most egregious offenders in this study handicapped themselves by nearly 2% with burdensome trading costs. It also gives a solid prescription for either managing money, or selecting a money manager: you have the opportunity to “buy” yourself a massive +1.88% per year in performance (1.99% minus 0.11%) by moving from the worst offenders to the least, with regard to trading costs. These hidden costs may be the single largest factors of causation of active manager underperformance.
Looking back at the 2012 SPIVA study, let’s look at the quartile breakpoints over the last three and five years for US Equity Funds:
Source: S&P Dow Jones Indices, CRSP. For periods ended Dec. 31, 2012. Outperformance is based upon equal weighted fund counts.
What could lower trading costs do to help performance?
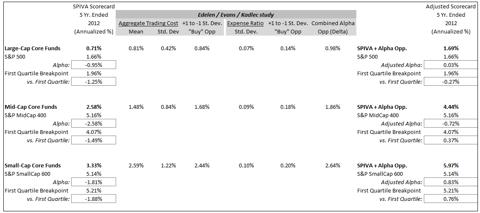
Looking at Large-Cap Core Funds, we know that the mean return according to SPIVA’s 2012 study for the five year period ended was +0.71% vs. the S&P 500 of +1.66%. Mid-Cap Core Funds gained +2.58% vs. the S&P MidCap 400 gain of +5.16%, and Small-Cap Core Funds added +3.33% vs. the S&P SmallCap 600 gain of +5.14%.
Large-Cap Core, Mid-Cap Core, and Small-Cap Core Funds underperformed the respective benchmarks by -0.95%, -2.58%, and -1.81% per annum over the five years ended 2012. Again, the Edelyn, Evans and Kadlec study showed us that the aggregate trading costs among Large, Mid and Small cap managers averaged 0.81%, 1.48%, and 2.59% respectively, with standard deviations around the mean averaging 0.42%, 0.84%, and 1.22%. Therefore, large, mid and small managers who could move from +1 standard deviation to -1 from the mean could “buy” 0.84%, 1.68%, and 2.44% in the way of performance.
If they did this, the five-year scorecard according to the 2012 SPIVA study would tell a slightly different story. The average Large-Cap Core Fund manager would have underperformed the benchmark by -0.11% per year, Mid-Cap by -0.90%, and Small-Cap would have beaten by +0.63.
Lowering expense ratios gives us an additional “buy” opportunity for alpha. John Bogle deserves credit for identifying inefficiencies in mutual funds cost, and has bellowed about the costs of mutual funds for decades now. While we think trading costs are more important than expense ratios in assessing a manager, fund costs still play a large role in manager performance and alpha generation.
The Edelyn, Evans and Kadlec study established that the expense ratio’s standard deviation averages around the mean for Large, Mid and Small managers were 0.07%, 0.09%, and 0.10%. This gives us the opportunity to “buy” another 0.14%, 0.18% and 0.20% by selecting managers one standard deviation below, not above, the mean. Adding this to our trading cost opportunity, Large Core Fund managers would have now beaten the S&P 500 by 0.03%, Mid Core would have underperformed by -0.72%, and Small Core would have beaten by +0.83% per annum. Moving +1 to -1 standard deviation for both trading costs and expense ratios would have “bought” 0.98%, 1.86%, and 2.64% for large, mid, and small managers per year in performance!
Looking at the quartile breakdown in the 2012 SPIVA study, “buying” this opportunity would put the Large Core Fund manager at +1.69% for five-years. This is just below the breakpoint of 1.96% for first quartile performers, and well above the second quartile breakpoint of 0.89%. This same “buy” opportunity would put mid and small managers significantly above the first quartile breakpoints. Mid and small managers would have returned +4.44% and 5.97%, against first quartile breakpoints which sit at 4.07% and 5.21%.
Source: Smead Capital Management
Using just the +1 to -1 standard deviation differential, of course leaves out about 1/3 of the managers who sit on the tails of the bell curve. Remember the CRR’s work that implied a 1.88% differential in trading costs by moving from the 5th to the 1st quintile. The opportunity to add significant value would be far greater if we could move from the top versus bottom quartile or decile of trading costs or expense ratios continuum’s.
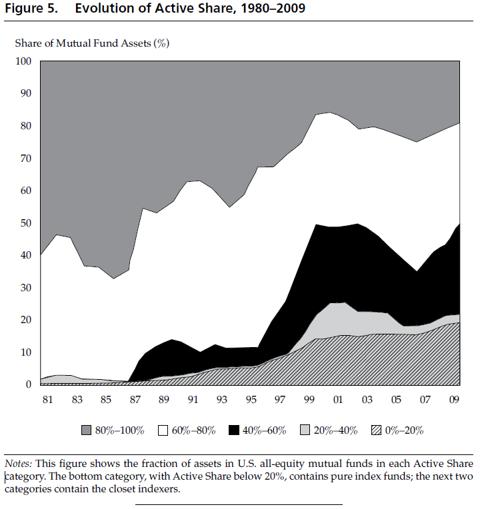
Great value is found where there is considerable scarcity, and we believe the opportunity to add value from these ideas is as compelling as ever. The landscape of managers practicing low frictional cost modes of investing in benchmark agnostic portfolios is barren and devoid of star power. Let’s look at a chart that Antti Petajisto put in a recently published article, “Active Share and Mutual Fund Performance”:
Source: Financial Analysts Journal, Volume 69, Number 4
Throughout the 1980’s, it appears that 60-65% of mutual fund assets were in portfolios that looked 80-100% different than their underlying benchmark. The majority of the balance was in portfolios that were 60-80% different. Prior to the late 1990’s, active manager’s actually managed money with high-conviction, selecting stocks based on bottom’s up research, looking relatively benchmark agnostic. Compare that with the latest readings, showing that 80-100% Active Share crowd comprised approximately 20% of today’s mutual fund assets, and the growth of Indexing and Closet indexers has gone from nearly zero to about 50% of Assets.
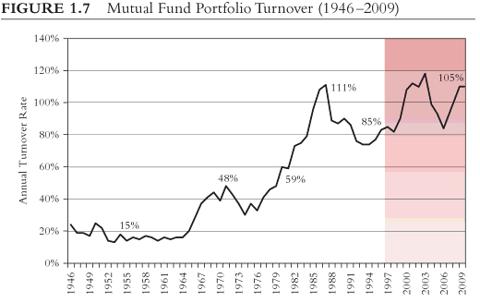
Similarly, the markets have remained inefficient with the simple math showing the damage high trading costs inflict on performance. Using turnover as a proxy, it appears the lack of conviction in betting against the benchmark is matched only by the affinity for churning portfolios 7x higher than the industry averages of 50 years ago. Consider this chart, from John Bogle’s 10th Edition of Common Sense on Mutual Funds:
Source: Common Sense on Mutual Funds
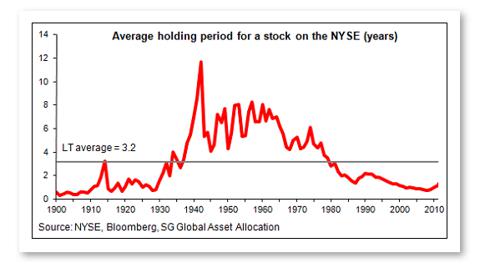
Most investment practitioners would agree that the stock market ultimately reflects underlying company fundamentals over a long period of time. With average mutual fund portfolio turnover exceeding 100%, the time horizon in question for the decisions being made is 3-5 quarters, at best. In fact, the average holding period of a stock on the NYSE bottomed in 2009 at just 9 months, and up-ticked last year to 14. This is a far cry from the average holding period of 3.2 years since 1900, and a peak of about 12 years in the 1940s. This brings us to question the fundamental basis and merit of all research being done in the Mutual Fund industry.
Overall, we get a clearer picture of what groundwork is being laid down in the shops of active managers. There is an absence of active managers who select stocks utilizing long durational time horizons and manage in ways agnostic to the benchmark.
Synthesizing these ideas stirs up newfound discontent among those who have accepted the creed of passive management enthusiasts and efficient market hypothesists. While many have taken a stance on the active versus passive debate, investors have nestled in a place of complacency and comfort. Observations of positive alpha among active managers is deemed aberrational, apparently doomed to revert to a below benchmark mean. The SPIVA type scorecards that come out each year on this subject are based on residual factors that show no causality or explanatory factors, yet we are at the highest pinnacles of capitalization on passive investing. We submit that this provides timely opportunities to those who dare to challenge the premise.
Based upon current research, we conclude that the underlying managers are the true culprits of underperformance, and the offenders are ubiquitous. This does not suggest the problem is categorical, and we see a potent prescription for those who want to seek out alpha. By moving the narrative away from risk mitigation, we can obtain great value while moving towards alpha identification and generation. Managing trading costs and expense ratios, looking at Active Share metrics, and finding Managers who select securities with long duration timeframes can offer great insight towards capturing opportunities investors have passed over in the marketplace.
The information contained in this missive represents SCM’s opinions, and should not be construed as personalized or individualized investment advice. Past performance is no guarantee of future results. It should not be assumed that investing in any securities mentioned above will or will not be profitable. A list of all recommendations made by Smead Capital Management within the past twelve month period is available upon request.
